

| . | . |
 |
 |
 |
| Intro | Scams | ||
| Safety | COVID Table | ||
| COVID1984 |
|
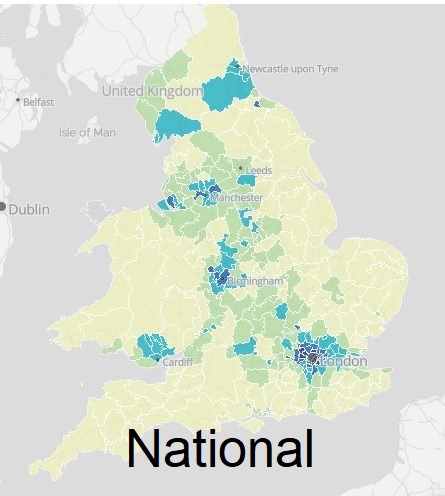
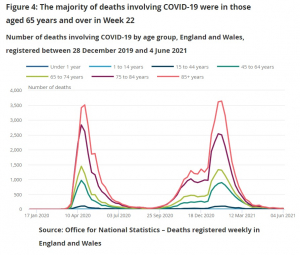
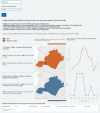
National Statistics |
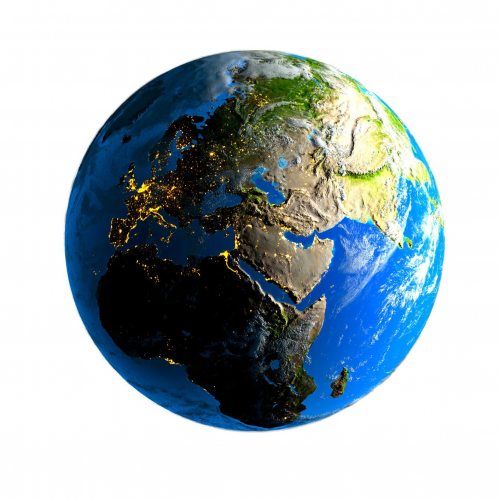
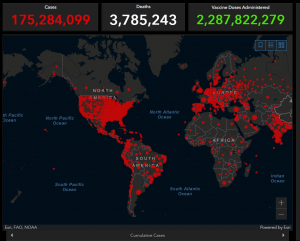
World Statistics |
World Mapping |
|
Click on image for Statistics |
||
Different countries may calculate statistics in different ways. They also may have different test approaches with different thresholds for positive and negative results, and different test accuracies. Some countries are in lockup and some not. All these factors make comparisons very difficult, both within the UK and internationally.
MAPPING (Click on images)
|
New York Times Vaccine Tarcker |
|
 |
Deaths now recorded within 60 days of positive COVID19 (PDF) i.e. 29JUN20 / Wk27 |
 |
|
 |
MRHA Vaccine Adverse Reactions Reports |
 |
|
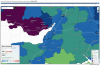 |
North Somerset - Zoom in (District e.g. PDF) |
 |
NSC Dashboard data Tests, deaths, hospitalisations, etc. (e.g. Overview, 17JUL20, 17NOV20, 15DEC20, 23APR21, 30APR21)) |
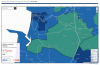 |
Bleadon Ward - Zoom in (e.g. PDF) |
 |
Bleadon Ward - (e.g. PDF) tests, deaths, hospitalisations, etc. |
 |
NHS COVID19 within 1 mile of Postcode area (e.g PDF) |
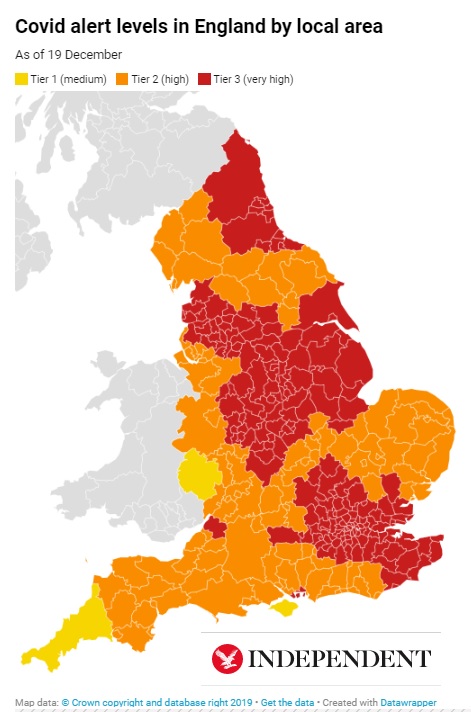 |
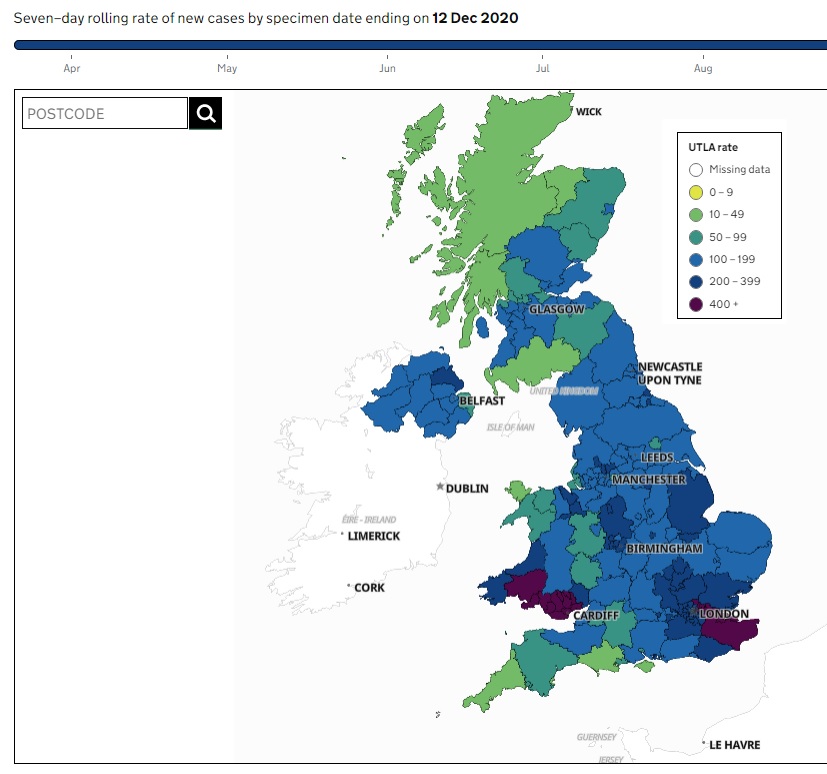
Covid alert levels in England by local area Independent Newspaper Government Tiers by Postcode |
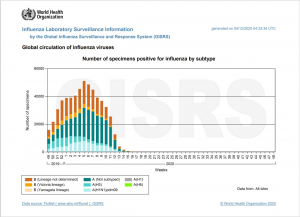 |
The Global Influenza Programme of WHO provides a global platform for influenza surveillance information reporting, analysis and presentation. Various graphs, maps and tables are available.(04DEC20) |
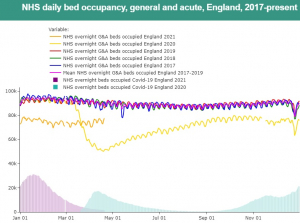 |
The UK's response to Covid-19, in facts and figures brings together various datasets into interactive graphs (08MAY21) |
 |
NHS Digiatl Data Dashboards (More info) |
_____________________________________________________
OLDER STATIC INFO
BBC and ITV mapping also global world maps , world statistics, ONS. EUROMOMO and from Real Clear Politics.
It has become increasingly difficult to compare UK government statistics as the way in which COVID19 cases are (potentially over) attributed, and the way in which the data is collected keeps changing, e.g 29 Apr 20 and 01 June 2020.
"Deaths reported by the Office for National Statistics (ONS) are based on the causes of death recorded on death certificates. These can include cases where the doctor thought it likely that the person had COVID-19, even when there was no positive test result."
Unlike other countries, the UK does not appear to release recovery rate information. (NB you may need to wait for the table data to display)
The goverment has published a dashboard showing reported cases of coronavirus in the UK. Also, various ONS Data.
|
Source Date |
North Somerset * (Age Standardised Mapping) |
South West ** |
England *** COVID19 |
||||
|
Total CV Cases |
CV Cases |
Cases |
Deaths | ||||
|
16 May 20 |
- | - |
(0.0005%) |
(0.01%) |
(0.2%)
|
(0.05%) |
|
|
09 May 2020 Cases & Deaths? |
- | - |
(0.0004%) |
09 May 20 (0.01%) |
(0.2%) |
(0.04%) |
|
|
Restated 28 Apr20?) |
- | - |
(0.0004%) |
6,405 (0.009%) |
(0.18%) |
(0.04%) |
|
| All Deaths | CV Deaths | - |
All Deaths |
CV Deaths |
All Deaths |
CV Deaths |
|
|
01 MAR-01MAY20 (Wk 18 - LA and UK) |
|
|
- | 13,004 | 1.909 | 140,904 | 31,738 |
|
01 MAR-24 APR 20 |
898 Total (0.001%) |
39 Total (0.00006%) |
- |
(0.02%) |
(0.002%) |
(0.18%) |
(0.04%) |
|
01MAR-17APR 20 NSC Mapping below |
292 Total (0.0004%) 100K pop
|
26 Total (0.00004%) /100K pop |
- |
(0.01%) |
(0.002%) |
(0.13%) |
(0.03%) |
*North Somerset population (by age) = 213,919 (2018) ** SW = 5,624,696 & ***England = 55.99 million (2019)
****UK Population = 67,834,517 (11 MAY 20)
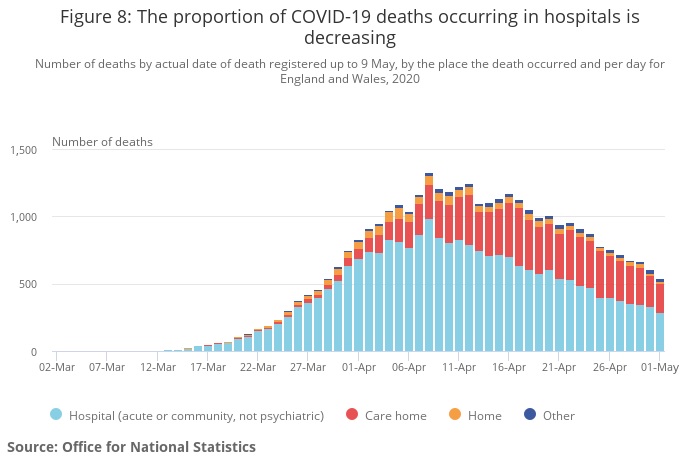
NB: The increase in cases (particularly for Care Homes) may be explained by delays in reporting, attribution of COVID19 as related or suspected cause of death and "Changes to the reporting process The way COVID-19 deaths are reported in England changed on 29 April 2020. Previously, deaths were reported by NHS England and only included deaths in NHS-commissioned services of patients who have tested positively for COVID-19." (See ONS statement and graph below). Does this affect the 5 year averages used by ONS for comparison purposes i.e. comparing different sets of data?
| United Kingdom | Worldwide | |||||
| Lab Cases | Deaths | % Deaths | CV Cases | Deaths | Recovered | |
| 16 MAY 20 | 240,161 | 34,466 | 0.05% | 4,750,411 | 313,805 | 1,830,514 |
| 09 MAY 20 | 215,260 | 31,587 | 0.05% | 4,200,957 | 284,150 | 1,502,595 |
| 02 MAY 20 | 182,260 | 28,131 | 0.04% | |||
See also Real Clear Politics statistics *World Population = 7.8 Billion (11 MAY 20)
The latest number of coronavirus (COVID-19) cases and risk level in the UK, is published by the government including number of tests. "As of 9am on 2 May, there have been 1,129,907 tests, with 105,937 tests on 1 May. 825,946 people have been tested of which 182,260 tested positive. As of 5pm on 1 May, of those tested positive for coronavirus in the UK, 28,131 have sadly died". Also see UK Government's COVID19 Testing Strategy (04 APR 20)
The information and public messages (nudges) associated with any statistics, and any related government strategy, needs to be timely, accurate and transparent to all concerned, including decision makers and members of the public.
Governments wil be using the statistics retrospectively to validate their approach to date. There was an independent review of the UK in response to The 2009 Influenza (Swine Flu) Pandemic by Dame Deirdre Hine (A Straight Statistics overivew is here - PDF). Dame Deirdre Hine concluded:
- "8.58 The four health departments should seek to build on their success, further explore the potential of digital media and social networking, and look to publish as much information as possible, using independent partners such as the Science Media Centre to engage the wider independent scientific community and the media.
- 8.59 A focus on providing a more accurate picture of the pandemic, and thus the levels of risk, through looking again at the communication of planning assumptions and greater transparency concerning scientific evidence will also be important in a future outbreak."
BBC and ITV mapping also global world maps , world statistics, ONS. EUROMOMO and from Real Clear Politics.
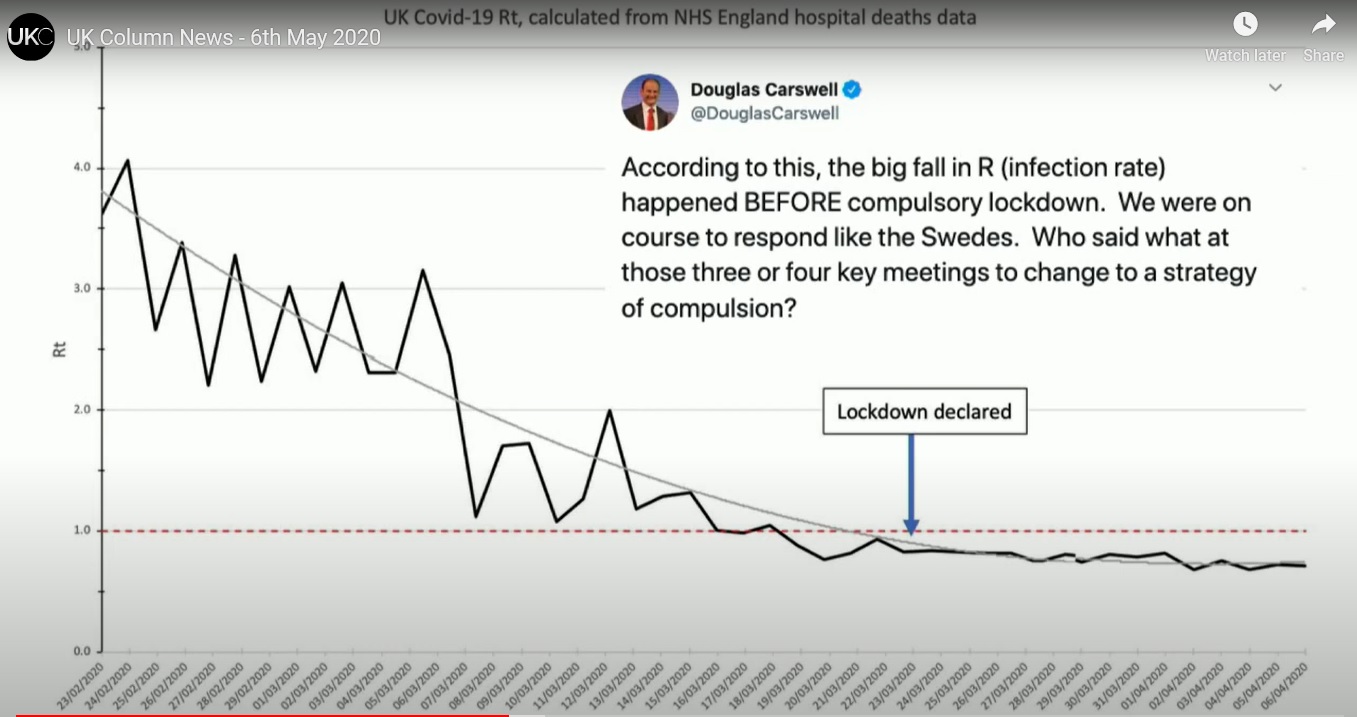
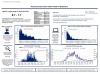
05 MAY 20: A graph showing the big fall in R (infection rate) happened BEFORE compulsory lockdow
02 MAY 20: ONS Mapping "Deaths involving COVID-19 by local area and socioeconomic deprivation Deaths involving COVID-19 by local area and socioeconomic deprivation: deaths occurring between 1 March and 17 April 2020" Release date 01 May 20 still current release as of 17 May 20 (Map).
COVID19 Restrictions Mapping - Independent Newspaper and Govt COVID19 Mapping (PDF , NSC Area, Ward Area) and Govt Daily Summary (PDF) and NSC Dashboard (Overview,17JUL20, 17NOV20, 15DEC20) and NHS COVID19 by Postcode (PDF) and Govt COVID19 by Poscode (PDF)
Back to Top of page.